关键词 "metrics visualization" 的搜索结果, 共 24 条, 只显示前 480 条
Streamlit enables creation and deployment of web apps for data science and machine learning.
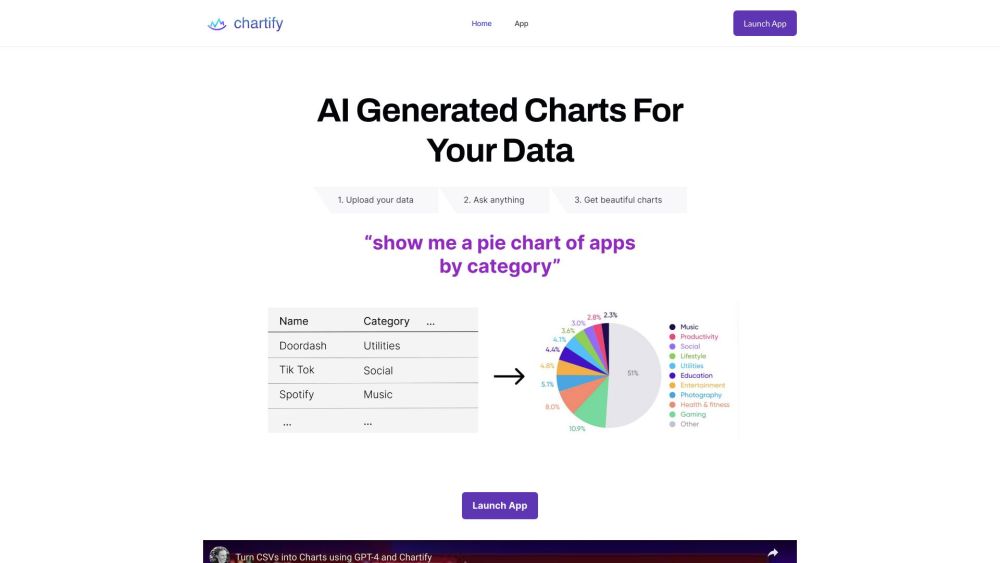
Chartify is an AI tool that turns data into interactive charts and recommends chart types.
Beige Flags provides tools for online presence and reputation management.
A tool to create professional reports, charts, and graphs based on user data.
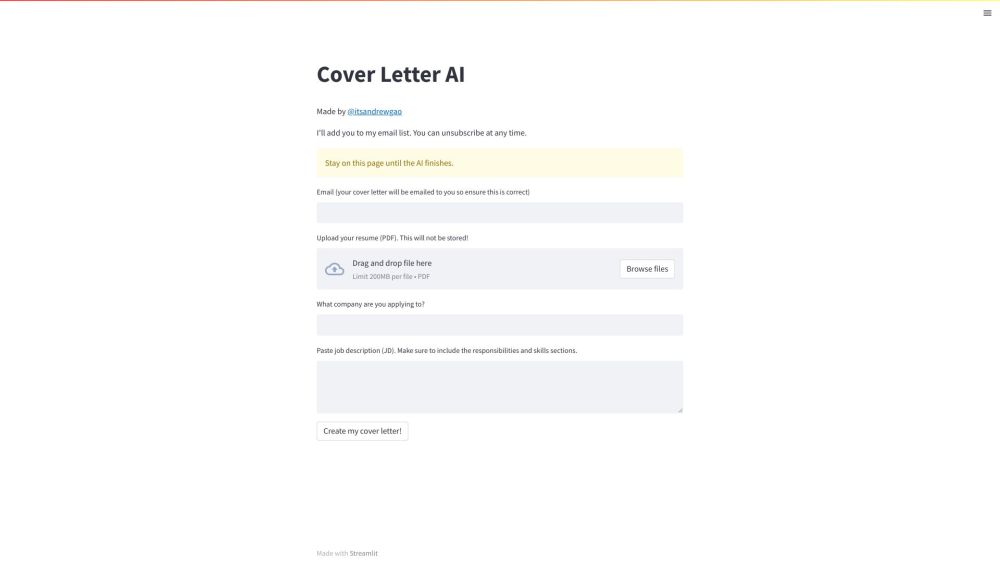
Streamlit is a Python library for creating and sharing web apps for ML and data science.
Client Crafter uses AI technology to help businesses create accurate customer profiles.
Bring ideas to visuals effortlessly.
ElusidateAI transforms data into reports, making data analysis and visualization fast and easy.
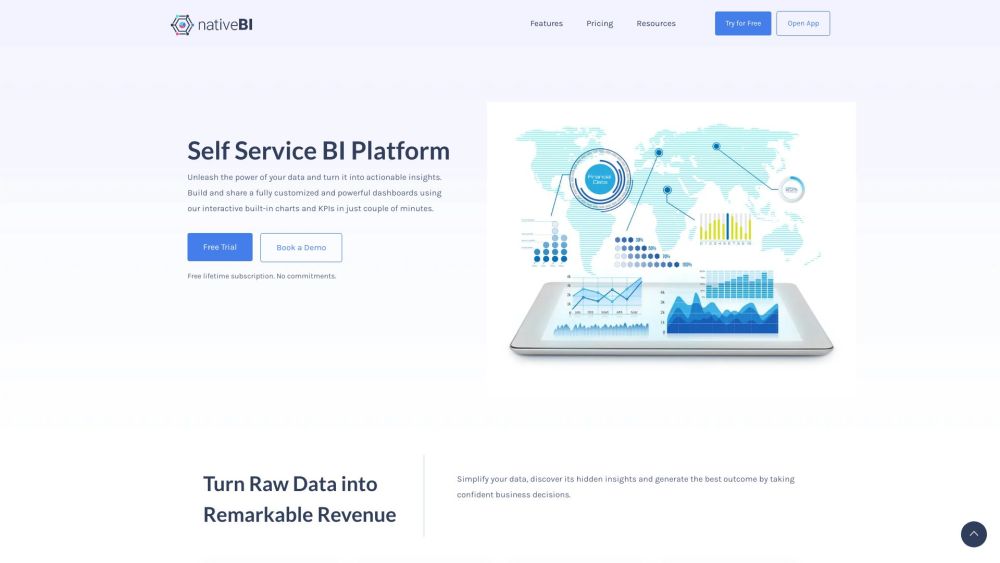
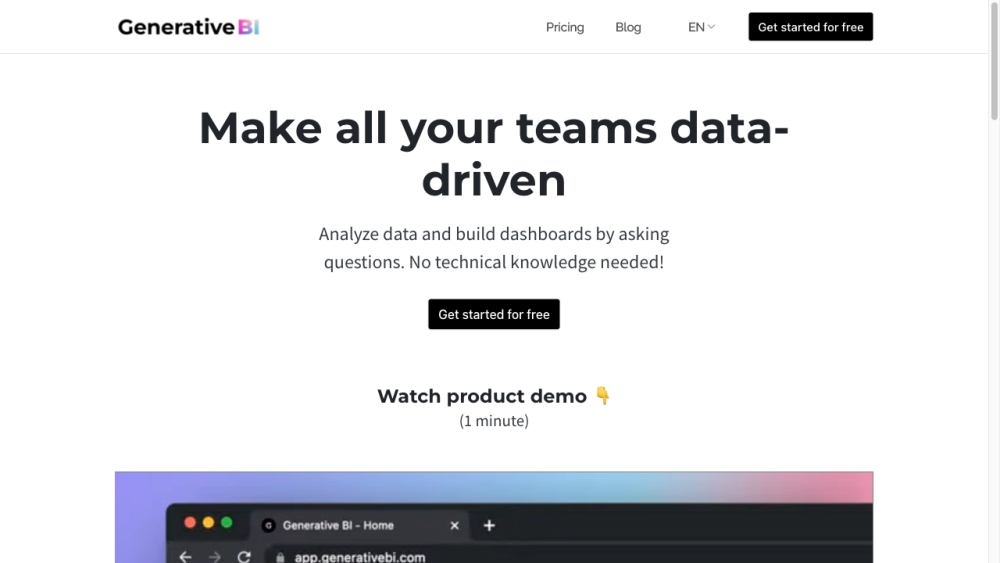
NativeBI is a platform that allows business leaders to access and analyze data easily.
SwiftSheets.ai is an AI-powered productivity tool for Google Sheets.
ColorpaletteAI is an AI-powered web app that creates beautiful color palettes from website descriptions.
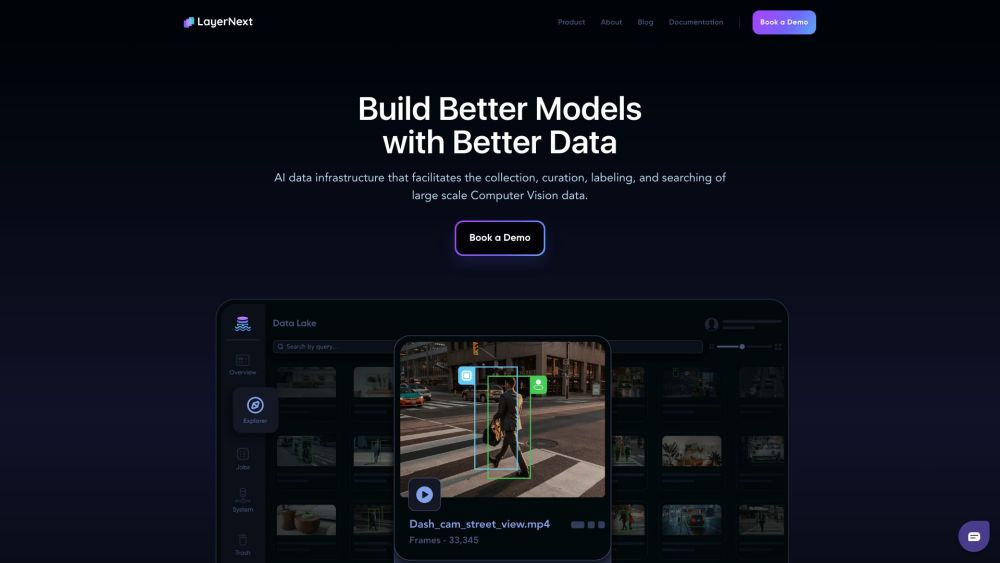
LayerNext is an AI data management platform for Computer Vision data.
AskSeoOnline is an AI-powered SEO tool with keyword research, competitor analysis, and reporting features.
Turn photos into captivating stories effortlessly.
HyperSuggest is a keyword research tool with 220 million keywords, helping users boost website rankings.
TRIS is an AI preprocessor that provides valuable insights for your in-house communication platform.
A versatile tool for analyzing and manipulating personal data using text-based commands.
AI-powered image generation platform.
No-code platform Prisms helps users build AI-powered apps by connecting data, user inputs, and building blocks.
Dystr automates workloads and assists with data analysis using AI.
DataInsights - Make data-driven decisions effortlessly.
STRING revolutionizes analytics with advanced features and capabilities.
VisualHound helps fashion designers prototype and visualize designs using AI-generated images.
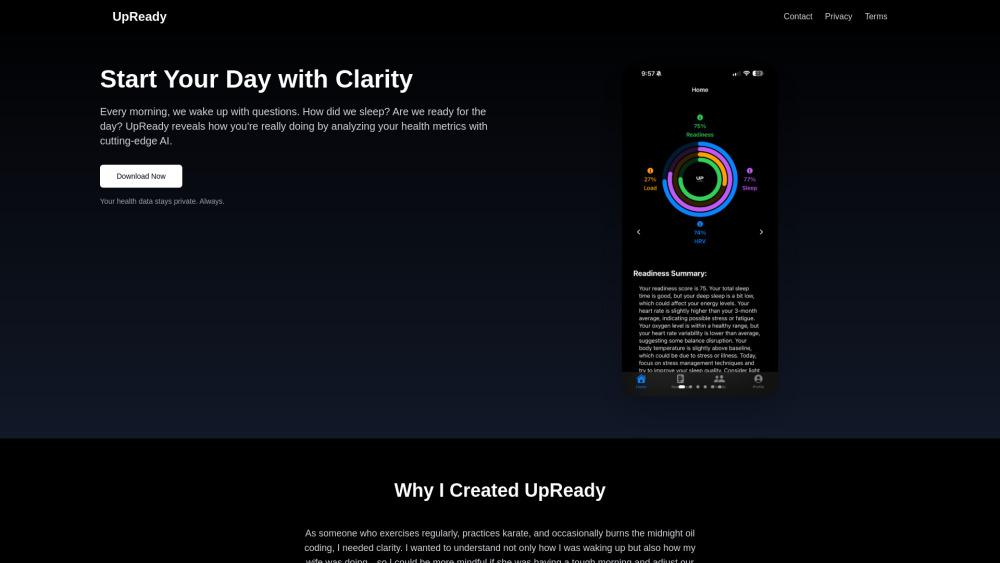
AI app for health metrics and daily readiness scores.
只显示前20页数据,更多请搜索
Showing 217 to 240 of 411 results