关键词 "metrics visualization" 的搜索结果, 共 24 条, 只显示前 480 条
AI Excel Tools: Advanced data visualization and AI to optimize Excel and Google Sheets workflows.
AI-powered interior and exterior designer. Generate photo-like designs in seconds.
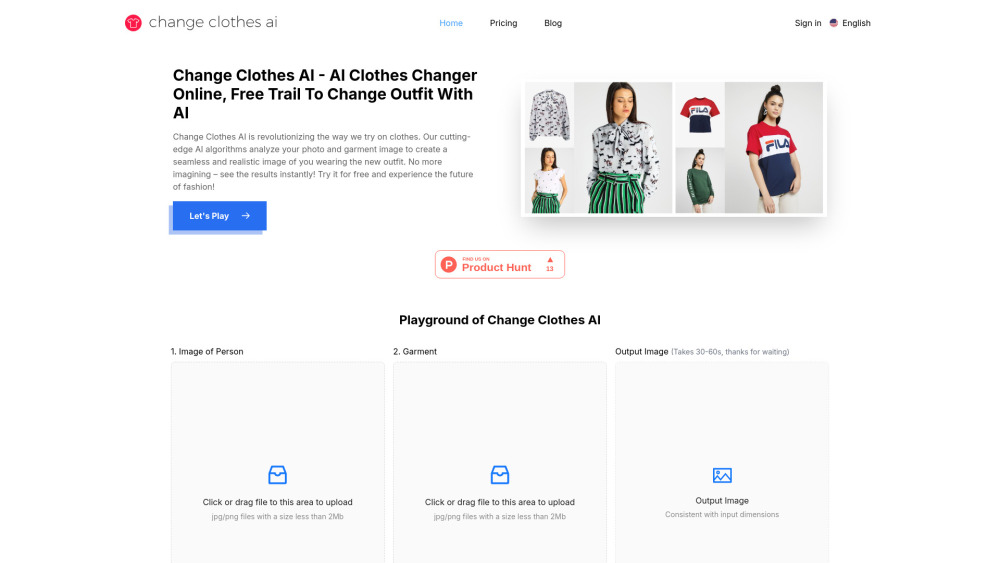
AI tool for virtually trying on outfits in photographs.
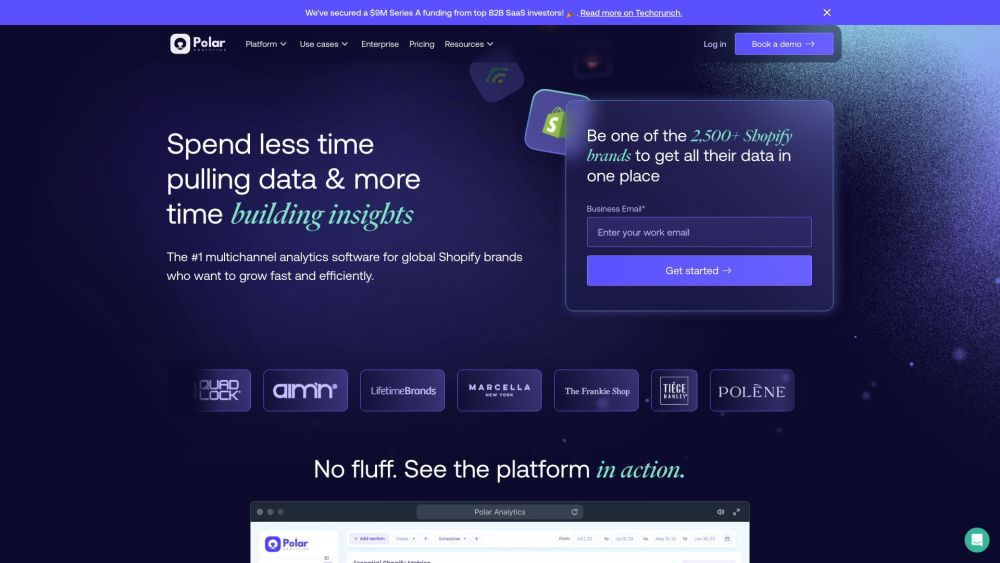
Effortless, centralized, smart Shopify analytics.
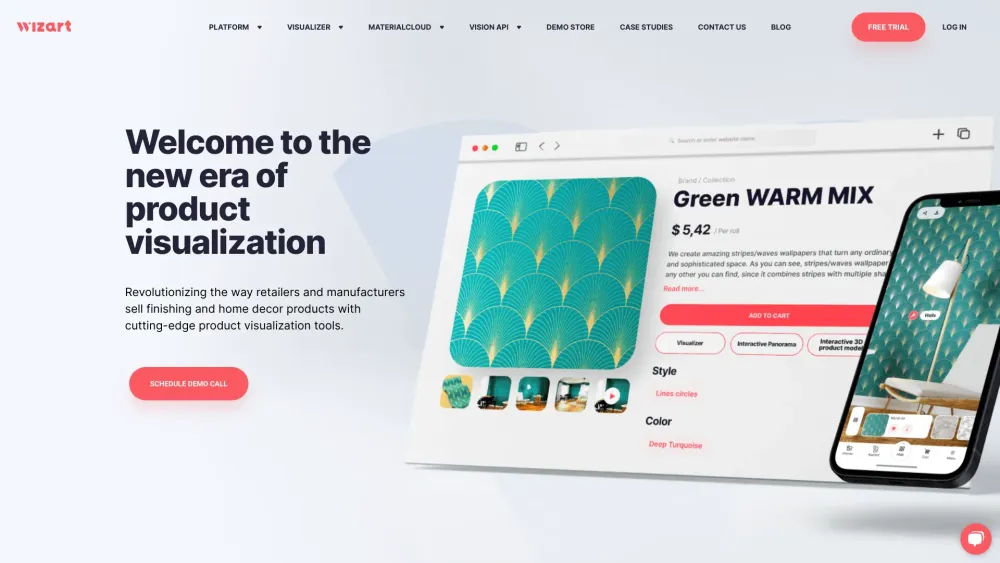
Advanced tools for visualizing home improvement products.
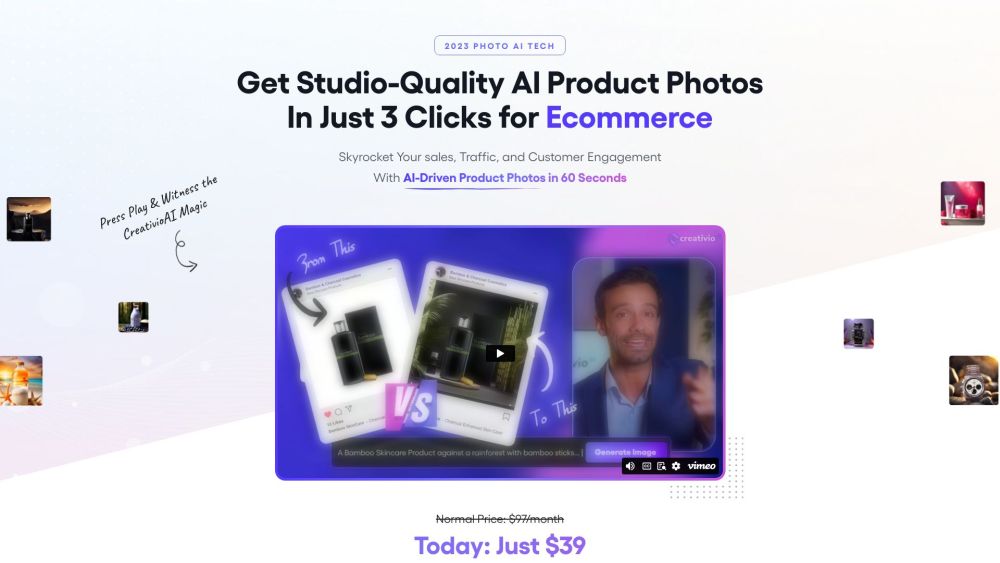
Revolutionary AI product photography software transforming the way products are captured and presented in just 60 seconds.
AI tool predicting future baby appearances using parental photos.
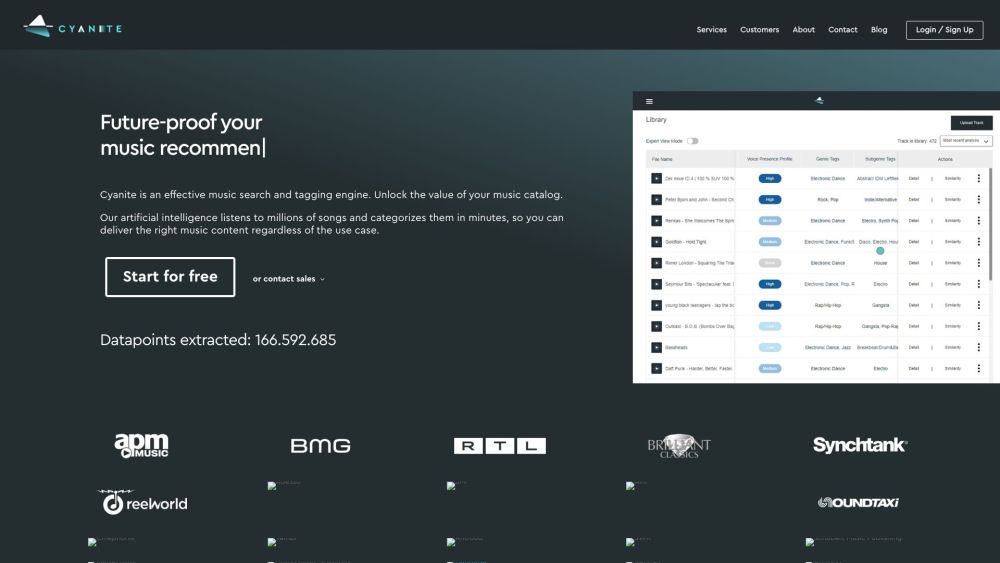
Cyanite.ai saves time by automatically generating metadata for songs and catalogs.
Transcription, research, data analysis, and NLP software
AI platform for generating fashion model imagery from flat lays.
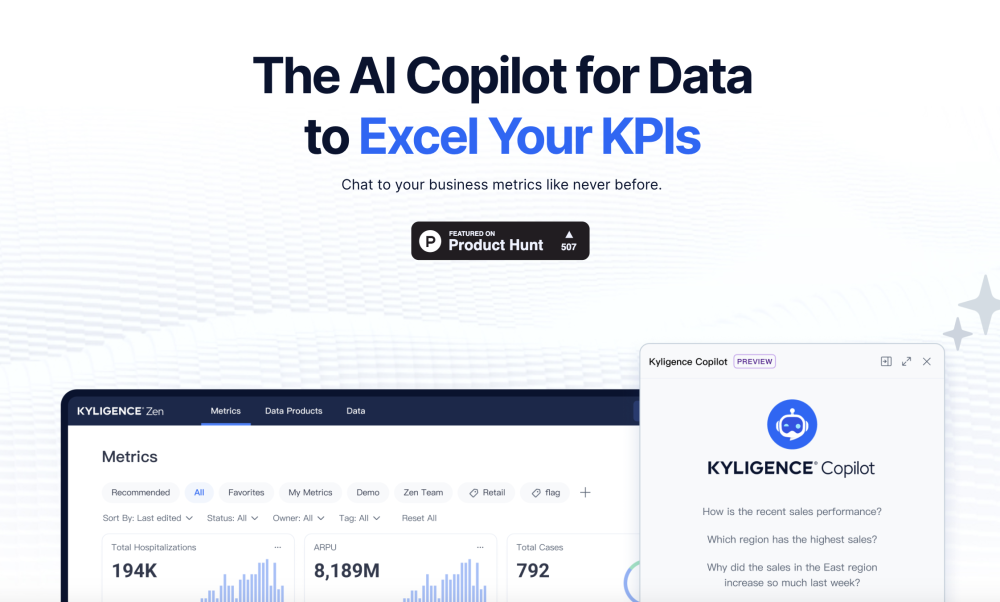
Kyligence Copilot: AI agent helping analyze KPIs, generating business summaries, and providing suggestions.
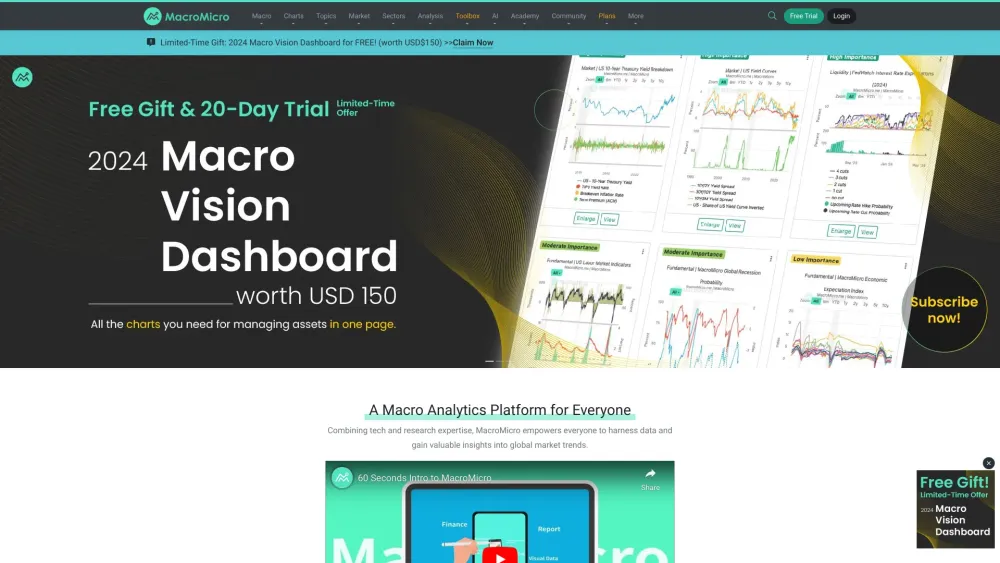
Empowering analysis through dynamic economic and financial charts.
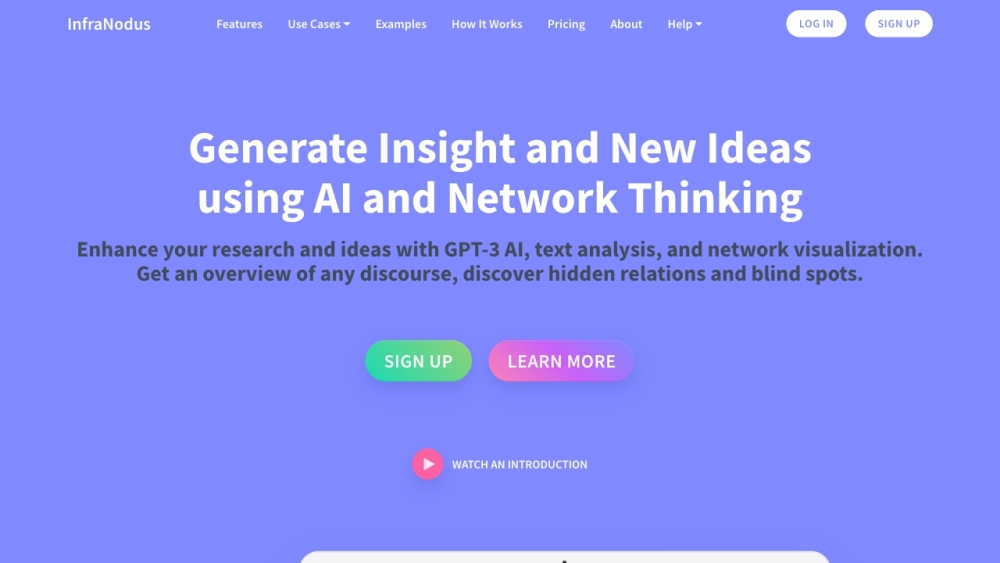
InfraNodus uses AI and network thinking to analyze and visualize text, gaining insights and improving perspective.
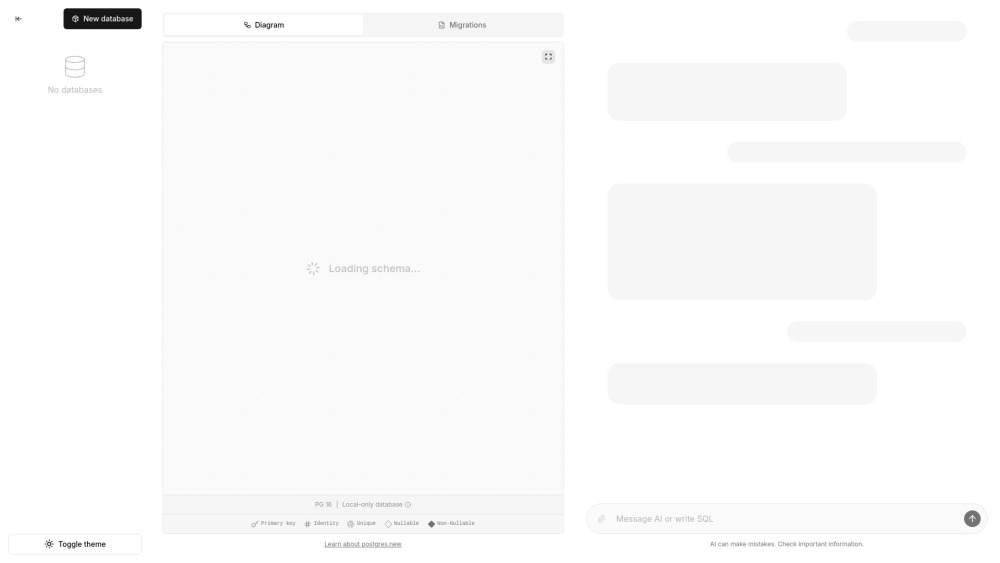
AI-assisted in-browser Postgres sandbox for database management.
Identity verification and remote monitoring using biometrics, computer vision, and machine learning.
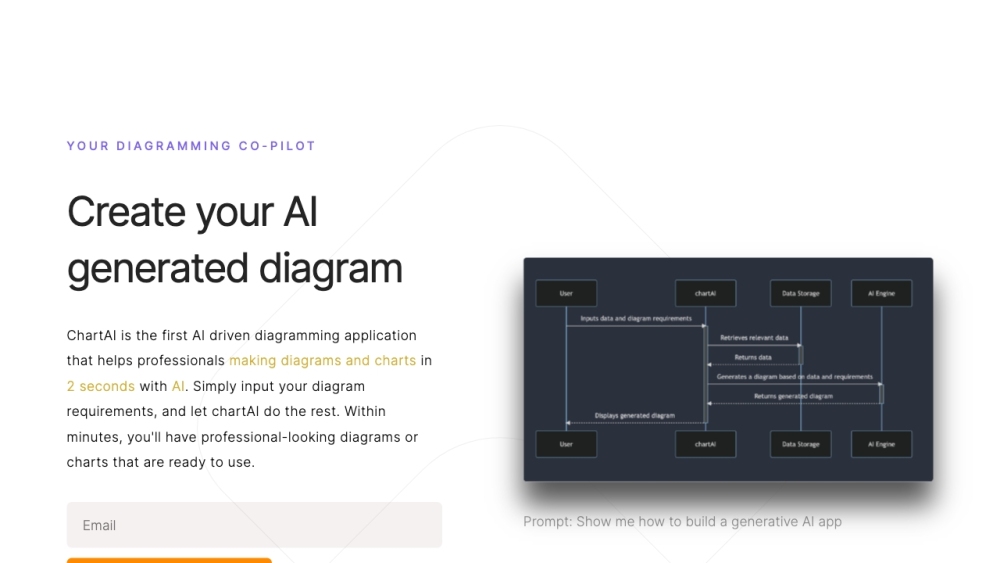
ChartAI uses ChatGPT to help users create and understand charts and diagrams.
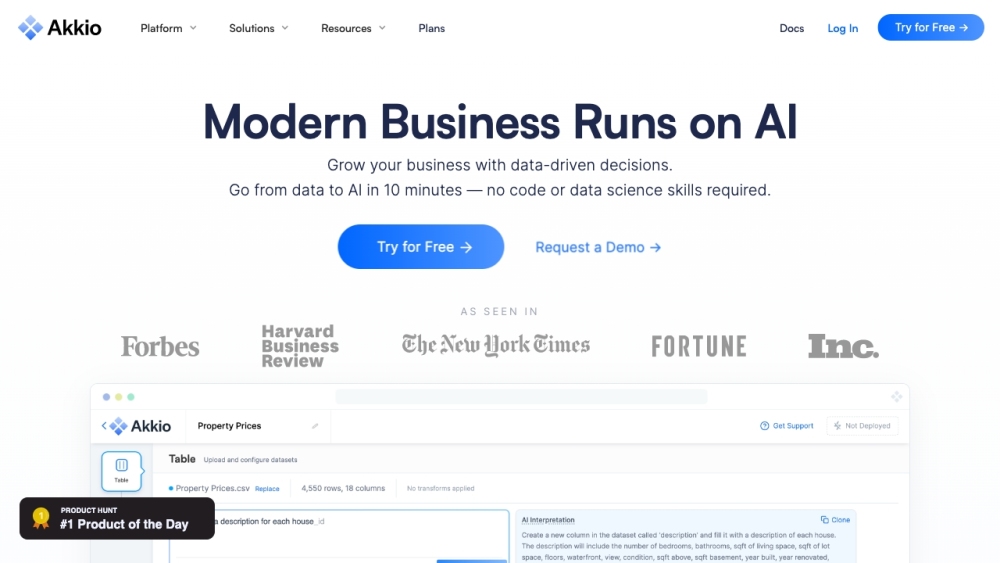
Akkio is a user-friendly platform for data analysis and AI integration.
Vizcom is a platform that turns sketches into concept drawings quickly and easily.
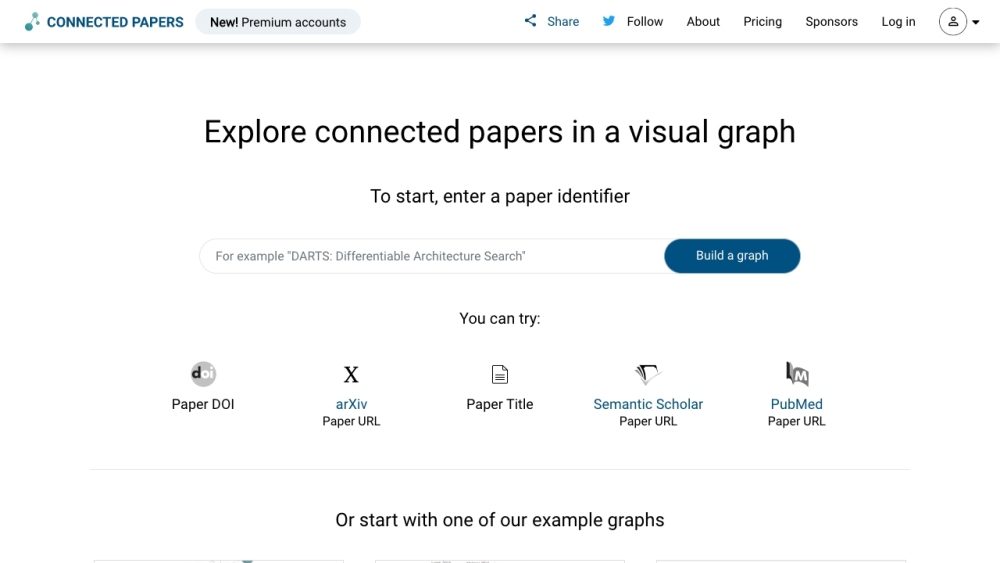
A visual tool to find academic papers.
Convert text ideas into visuals easily.
AI judges your X profile and places you on a fun map.
AI data analyst for data visualization and analysis 人工智能数据分析师,负责数据可视化和分析
A Micromanagement Tool for Development Workflows: Helps coding agent plan, track, and visualize sequential development tasks with detailed commit-level granularity. Features interactive visualization,
Static Code Analysis and Visualization. Convert Code to UML and Flow Diagram and explain by AI.
只显示前20页数据,更多请搜索
Showing 361 to 384 of 411 results